
We've recently written two new courses, Tableau for Data-driven Decision Makers and Power Bi for Data-driven Decision Makers. These classes are for professionals in any job role that uses Tableau or Power BI to make decisions, or to report data to stakeholders, executives, or customers.
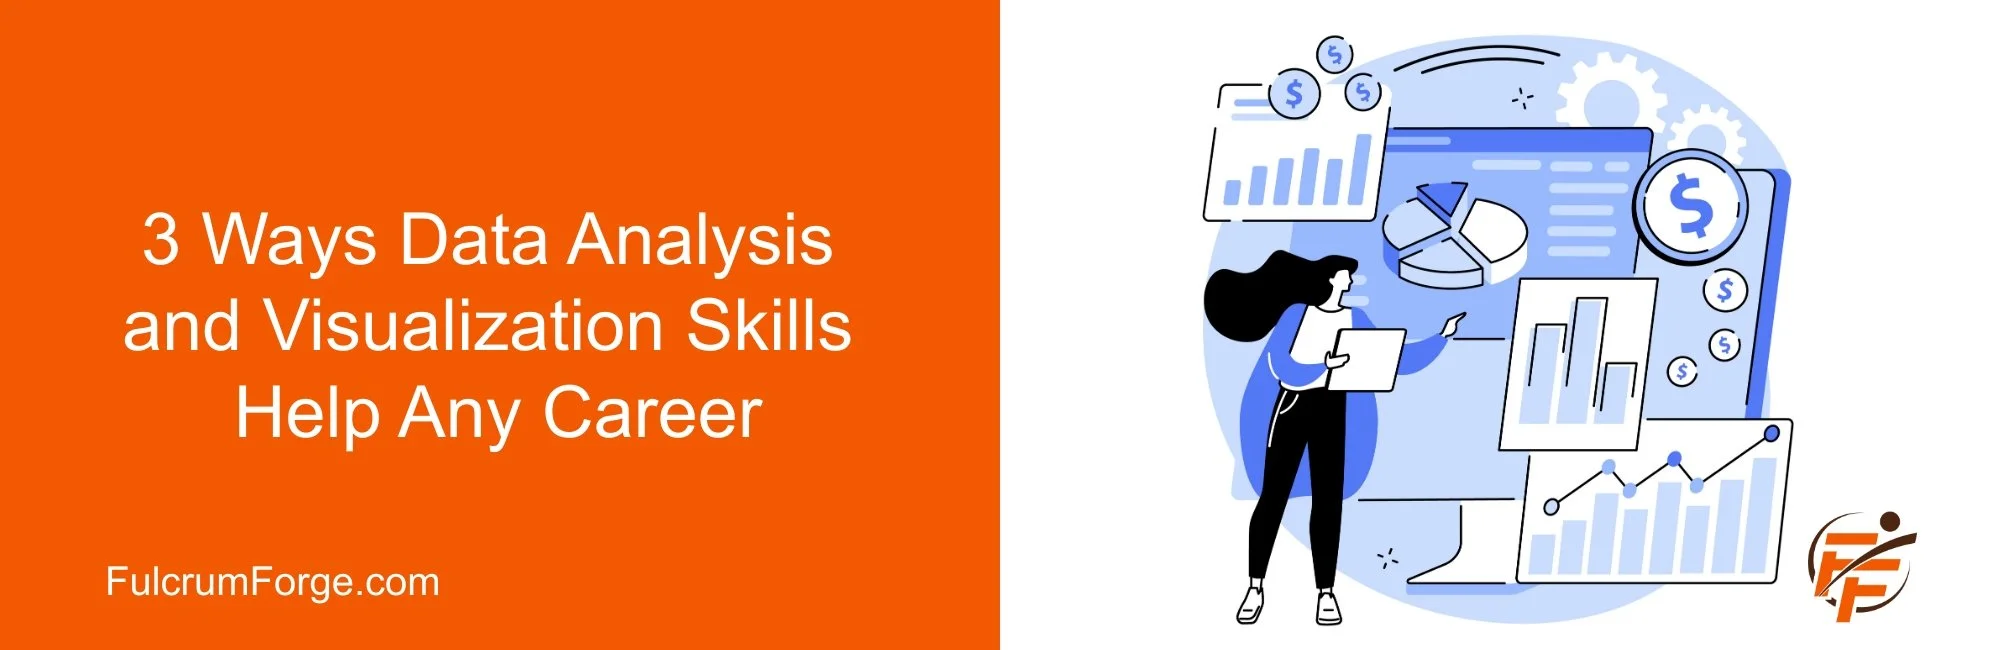
In organizations that collect and analyze data, having the skill to perform data analysis and create visualization can boost your performance and your career. In this article, we're going to look at three key benefits of using data analysis and data visualization skills to make decisions, report results, and justify your activities.
You can read more about the classes, what they cover, and who should take them here.
Making Decisions - Finding the Insights Most Important to You
If you have raw data or if you get analysis from an analyst, data analysis skills can help you find insights that are most important to you. You might be thinking, "I have an analyst for that." But you don't, the organization does. Data analysts often perform analysis based on broad organization goals and initiatives. Your role, your team, or your project may have a unique perspective.
For example, the organizational data analyst might create reports related to product sales generally, while a product manager might be interested only in the sales of the project they manage. The data analyst might create reports on returns and customer satisfaction, but the engineering team may want more detail on products returned due to a lack of features versus defects. Regional managers may get all kinds of data analysis and reports from corporate but may only be interested in data about the region they work in.
While you might be able to ask the data analyst for new reports, often, that doesn't work out so well. Organizational data analysts have a lot on their plate and must prioritize requests from organizational leadership, they might not have time to prepare unique analyses for you. Furthermore, analysts don't likely have specific domain knowledge about your role, team, task, or focus area and so aren't best equipped to look for insights that are meaningful to you.

You can take a huge report on all your company products...

…and refine it to show the comparison of youth products you're interested in.
You have the data and the domain knowledge. If you get familiar with the tools like Tableau or Power BI, then you can analyze the reports you're given, drill in to get more detail, filter them to see only the information you're interested in, or create new reports using only the data that matters to you. Even better, you can do it whenever you need without having to wait for the analyst to get back to you. You can find the insights that matter most to you, stay well-informed, keep stakeholders up to date, and make better decisions faster.
Reporting Results - Telling the Story You Want to Tell
In addition to having data analysis skills, if you can modify data visualizations (those reports the analysts give you) or create your own, you can apply your own analysis and tell the story you want to tell.
Sometimes this is very simple but very important. A simple annotation on a simple data visualization like the one below can make the case for a new employee.

Being able to annotate and customize reports lets you share your perspective and insights and takes the guesswork out of the visualizations. In the case of the visualization above, when it's presented to stakeholders, there's no guesswork needed. The explanation is included with the visualization.
The ability to customize, annotate, and create your own visualizations lets you put your own spin on reports and visualizations, allows you to explain your perspective to others, and helps you tell the story you want to tell.
If you want to be an influencer in your organization, you’re going to have to show your work. Data visualization is how you do that." - Bob Carver
Justifying your Activities - Getting a Yes
Those two skills, the ability to perform analysis and customize and create visualizations, give you another superpower, it helps you sell. What? You say you're not a salesperson? Let me ask you this, do you ever:
Submit a budget for approval?
Try to get projects or initiatives staffed and funded?
Have to explain the value your team, your product, or your service provides?
Make presentations to clients, partners, or executives?
If you do any of these things, you're doing sales. When you're asking for something, showing the data that your decision is based on is like showing your work. It shows you're thoughtful, it shows you've done the analysis, and it provides facts to approvers that back up what you're asking for. That can be the difference between yes, and no.
Conclusion
If you or your team use Tableau or Power BI and have the same types of questions, this course is for you. See the full Tableau class description here and the full Power BI class description here. See our class schedule or reach out for a free 15-minute training consultation.
You can see all of our content about these courses here.
