

Data Analysis and Visualization for Career Growth
What you need to know to add the most valuable skillset to your career path.
Data science is a growing career field because everyone is collecting data on pretty much everything all the time. Since we can now analyze all that data and turn it into compelling visualizations, data science and data visualization skills are in high demand, and demand is growing, as shown by the surge in data science jobs and the growing number of other fields and job roles that now require data science skills.
Today, anyone who works with data can stand out by being able to analyze data, discover insights, and create compelling visualizations to explain them. From project managers to business analysts to experts for any domain of knowledge, and anyone working to optimize anything, data analysis and visualization skills can make help you make your point, justify your project, or win the client.

Download this guide as an ebook to read offline and share internally. See:
Data analysis and visualization skills you need.
12 Data science job roles.
How these skills benefit your career and organization.
Examples of actionable insights from data analysis.
Some of our favorite data visualizations.
Our data visualization class learning tracks.

Chapters
Keep scrolling or click a link below to jump to a chapter you're interested in.
CHAPTER 1: What are Data Analysis and Visualization Skills
CHAPTER 2: 12 Data Science Jobs and Salaries
CHAPTER 3: How Data Analysis and Visualization Benefits Your Career
CHAPTER 4: How Data Analysis and Visualization Benefits Your Organization
CHAPTER 5: Some of Our Favorite Data Visualizations
CHAPTER 6: Eight Examples of Actionable Insights from Data Analysis
CHAPTER 7: Which Tool is Right for Your Data Science Task?
CHAPTER 8: How to Start Your Data Science Journey
CHAPTER 9: Data Visualization Learning Paths
CHAPTER 10: Python Learning Paths
CHAPTER 11: AI and ML Learning Paths
CHAPTER 12: Conclusion
What are Data Analysis and Visualization Skills?
There are many reasons to be interested in data science and data visualization. There are a growing number of data science-related career opportunities. In fact, From 2016 to 2019, data scientist was the number one job in America. Fortune reports that for Gen Z, data science jobs are their top pick and that the number of data science jobs will grow by 22% by 2030. This Is Statistics lists Data Scientist as a top job for 2022, not only in terms of salary but also for best work-life balance.

Data science is a growing career field because everyone is collecting data on pretty much everything all the time. Since we can now analyze all that data and turn it into compelling visualizations, data science and data visualization skills are in high demand, and demand is growing, as shown by the surge in data science jobs and the growing number of other fields and job roles that now require data science skills.
Anyone who has access to data relevant to your job, your organization, or its processes, services, and business conditions, can stand out by being able to analyze data, discover insights, and create compelling visualizations to explain them. Project managers, business analysts, experts for any domain of knowledge, researchers, healthcare specialists, engineers, and anyone working in any field to optimize any process or service can show their work and make their points more effectively by visualizing the data that's informing their decisions and recommendations.
More than this, while these skills help you stand out today, data science and visualization skills will likely be required for those jobs in a few years.
Showcasing Insights for Better Decision Making
As you likely know, data visualizations showcase insights from data using charts, graphs, and other visualizations. Simple data visualizations are charts and graphs, and you can use a wizard in Excel to quickly turn a table into a pie chart. So why do you need to read on? Three reasons:
First, you should never use pie charts, there, I’ve said it, click here to see why.
Second, many critical insights come from analyzing data from multiple sources. You can’t wizard up a chart with three clicks when looking at two different data sources.
Third, while wizarding up a chart is better than nothing, being thoughtful and creative in presenting your findings from data analysis is how you get the most benefit from data visualization skills. It can help you make your point, justify the project, or win the client.
When done right, visualizations make it easier to see trends in the data and relationships between data that aren't easy to see when looking at tables full of numbers. The goal of data visualization is to help people make better decisions, see trends, and understand evolving circumstances.
Where data is the science, visualizations are the art and can be as unique, independent, and creative as the person creating them. One might be as simple as charting some numbers in Excel to show a relationship:

Screenshot of Data Analysis and Visualization with Excel activity workbook.
Another might be an interactive dashboard with multiple connected charts like this one created in Tableau that allows users to drill into a company's profit data for each state.

Or it can be a story brought to life with data like this story by Jeff MacInnes published on The Pudding about the global research effort to combat coronavirus:

It Starts with Questions
The reason you analyze data is to find some answers. Maybe you’re looking for something specific, like which products sell the best or which customers buy which products. Perhaps they’re more vague or general, like, what does the data we collect on our customers tell us about their buying habits?
Either way, you have the information you want to extract from data and questions you need to answer.
Skills are Required
While the tools have rich features and offer many ways to both visualize insights and share those visualizations, you still need some level of data science skills to work with the data, analyze it to find meaningful insights, and create compelling visualizations. Analyzing data is a multi-step process that can be complicated, and we’ve covered it in a different article, but, at the risk of oversimplifying it, there are three broad skills needed to create a data visualization:
Collect data.
Analyze data.
Visualize data.
Collecting Data
The data that will provide insights, show trends, and help make decisions has to come from somewhere. You can buy data, use data published by any number of organizations and agencies or use data your organization has or is actively collecting.
The Excel example above came from an analysis of internal HR data cross-referenced with order processing data. The profitability dashboard came from a study of internal locations, sales, and product data—the COVID research visualization from analyzing aggregated publicly published articles on COVID-19.
Suffice it to say you might be analyzing a combination of data from local internal sources, national public sources, or purchased data. No matter what data you’re using, you will need to connect to it, and this is where you need some data science skills. Data might be a spreadsheet or .csv file, in a database like SQL, MySQL, or MongoDB, or a flat file scraped off the web by some app. Connecting to data sources is a data science skill that you need if you’re going to create data visualizations, but that’s usually just the first step; once you connect to the data, you typically have to clean it up by getting rid of data you don’t need, making sure the data you want isn’t riddled with null values, that all the data types are correct, and that you’ve added any calculated fields you need to answer the questions or compare and contrast the information you’re interested in.
Once this is done, you’re ready to analyze the data.
Analyzing Data
Analyzing data is the process of examining data to find correlations between data elements, identifying patterns and trends, and discovering important new information which may have previously been unknown. Data analysis is a data science skill. In the world of data science, the job title data analyst and data scientist mean different things. I’m not going to get into the difference between data scientists and data analysts in this article because it’s a whole thing. Data Scientists think they’re better than Data Analysts, and Data Analysts think they’re underappreciated. Both groups are correct, as confirmed by the fact that data scientists bristle at being called data analysts and data analysts love being called data scientists. We have a whole infographic on the different data science job roles, and I’ve already said too much. Both groups analyze data, and if you are going to create insightful and compelling data visualizations, you will need to do so as well.
You will have to open data sets, sometimes very large data sets, find correlations between data, perform calculations, create quick visualizations to help spot insights in the data you might otherwise miss, and in many cases, perform statistical analysis to help identify or confirm findings, and create refunded data sets to help you focus on the areas you’re most concerned with. You may even need to write code to analyze data or perform a comparison, correlation, or statistical analysis on data.
Once you’ve found what you’re looking for or something interesting, you can create a rich visualization to showcase your findings.
Visualizing Data
This is where you take time to create rich visualizations to interpret and explain the findings and patterns found in the data.
Tools can help as they have been developed or evolved with the rise of big data and the computing power to analyze it. Microsoft Excel is probably the most familiar, followed by products for creating more advanced visualizations like Tableau and Power BI. Data visualization libraries have also been added to programming languages like Python to help build interactive online visualizations.
Creating rich visualizations requires knowledge of the data and skill in using visualization tools, and all of this becomes very powerful when combined with vision. As I said earlier, being thoughtful about presenting data and findings benefits you in many ways. You’ve done the analysis, and great visualizations help you tell the story the way you want it said, accentuate the points you want to focus on, and make the argument you want to make. This can help anyone in any job role that has to justify time, expense, approach, or decisions made in the past, and it can help explain the choices you’re advocating for now.
What Comes Next?
Creating compelling data visualizations requires data science skills to collect and analyze the data and skills and creativity to visualize it to make your point. When done thoughtfully, you can bring the story in the data to life, unlocking the power of the data to make it prove your point for you. It can help in any career path, but data analysis and visualization skills also open up several dedicated data science career paths.

12 Data Science Jobs and Salaries
Data Science encompasses many job roles that have some overlap and may change in the future. Some of the titles mean different things to different people.
Data Visualization Jobs
Data visualization job roles focus on the process of analyzing data and creating a graphical representation of it. This provides an accessible way to see and understand trends, outliers, and patterns in data.

General Skills:
Bachelor's degree in statistics, finance, mathematics, computer science, or a relevant field.
General Experience:
Using Data Analysis, SQL, Excel, Data Visualization, Tableau, Power BI, etc.
Data Visualization Specialist
Salary Range:
$49,000 to $127,500
Avg Salary:
$85,000 annually
Responsibilities:
Build interactive data visualizations
Refine assets based on feedback
Data Visualization Analyst
Salary Range:
$51,000 to $150,000
Avg Salary:
$92,500 annually
Responsibilities:
Create reports with key metrics
Gather data sources to address problems
Create strategy through testing
Create strategy through data analysis
Transform and clean data sources
Data Visualization Developer
Salary Range:
$62,000 to $150,000
Avg Salary:
$107,800 annually
Responsibilities:
Develop BI solutions
Ensure maximum data cleanliness
Design and deliver end-user training
Provide technical support as necessary
Data Visualization Engineer
Salary Range:
$65,000 to $180,000
Avg Salary:
$117,750 annually
Responsibilities:
Design and support data visualizations
Implement best practices for dashboards
Design and test analytics platform code
Debug apps, trace code and fix bugs
Data Science Jobs
Data science job roles focus on the process of extracting insights and meaning from data. This includes capturing, processing, analyzing, and maintaining data.

General Skills:
Bachelor's degree in statistics, computer science, or a relevant field.
General Experience:
Using statistical computer languages like R, Python, SQL, and so on, Data Modeling, and Business Intelligence.
Data Analyst
Salary Range:
$46,000 to $110,000.
Avg Salary:
$74,250 annually
Responsibilities:
Apply statistical analysis to data
Find insights and trends
Identify trends and patterns
Create data based reports
Maintain databases and systems
Data Scientist
Salary Range:
$69,000 to $148,000
Avg Salary:
$107,000 annually
Responsibilities:
Implement data processes
Improve data quality
Conduct statistical analysis of data
Identify data patterns and trends
Develop predictive models
Data Engineer
Salary Range:
$55,000 to $181,000
Avg Salary:
$109,800 annually
Responsibilities:
Improve data usage
Analyze data sets for insights
Script/automate data science tasks
Develop an analytics infrastructure
Data Architect
Salary Range:
$70,000 to $203,000
Avg Salary:
$144,250 annually
Responsibilities:
Determine database requirements
Structure databases
Propose database solutions
Define database specifications
Troubleshoot data system problems
Artificial Intelligence (AI) and Machine Learning (ML) Jobs
Machine Learning and Artificial Intelligence job roles are more focused on the algorithms used in data science and the software engineering around implementing the model. They are more deeply involved with machine learning and artificial intelligence.

General Skills:
Bachelor's degree or higher in computer science, engineering, machine learning, mathematics
General Experience:
Using statistical computer programming languages and platforms like R, Python, C/C++, and so on, AI, ML, etc.
Artificial Intelligence Developer
Salary Range:
$30,000 to $189,500
Avg Salary:
$111,100 annually
Responsibilities:
Build data and model pipelines
Manage the code infrastructure
Build statistical modeling algorithms
Build and maintain scalable ML solutions
Machine Learning Engineer
Salary Range:
$64,500 to $218,500
Avg Salary:
$129,000 annually
Responsibilities:
Design and maintain ML systems
Transform data science models
Create ML algorithms
Develop ML applications
Train ML systems
Machine Learning Scientist
Salary Range:
$78,500 to $247,500
Avg Salary:
$150,900 annually
Responsibilities:
Research algorithms
Probabilistic match algorithms and models
Develop innovative, scalable solutions
Create models
Ensure ML programs meet requirements
Artificial Intelligence Architect
Salary Range:
$30,000 to $234,900
Avg Salary:
$153,800 annually
Responsibilities:
Develop data models and algorithms
Use predictive modeling
Develop A/B testing framework
Test model quality
Develop processes and tools
Analyze model performance
How Data Visualization Benefits Your Career
As stated earlier, data analysis and visualization skills can help you in any job role where data is used to make decisions. It can help you:

“If you want to be an influencer in your organization, you’re going to have to show your work. Data visualization is how you do that."
- Bob Carver, Fulcrum Forge
The process of analyzing and visualizing data helps you keep things in perspective.


Data visualization reminds you to show, not tell.


Data visualizations help you cut through the noise and capture attention!

It Helps You Sell!


Data Visualization Skills Go With You
Jobs and roles that use data analysis and visualization:

Moving forward, while openings for data scientists are increasing, other roles are becoming increasingly popular where data scientists can apply their multifaceted experiences.

How Data Visualization Benefits Your Organization
Organizations are using data-driven decision-making to make better decisions faster. That’s why data analysis and visualization skills can help you advance in many different career paths. You might wonder, what’s driving this change and this focus on data? And what problems are being solved, and what decisions are being made with this data? Let’s take a look.
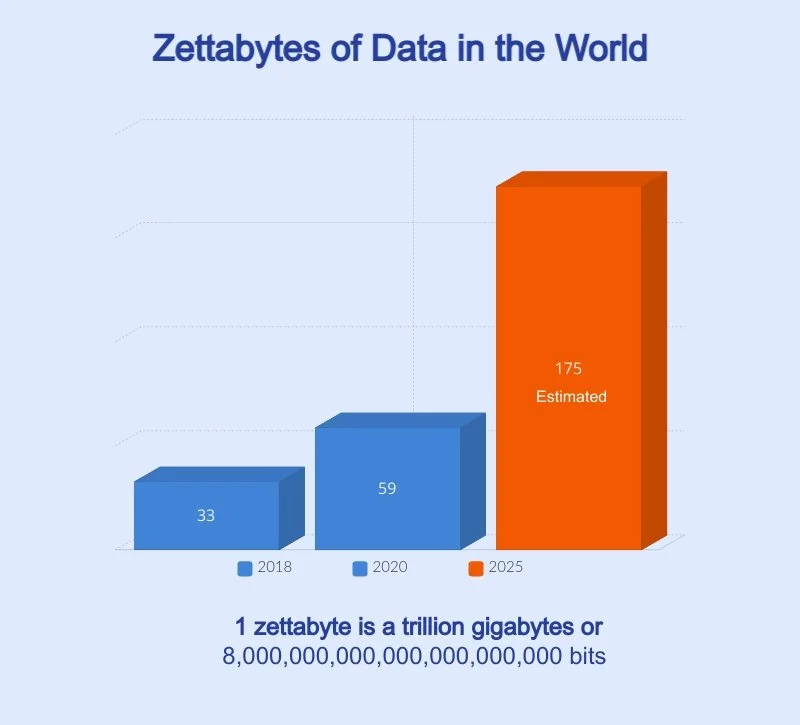
Huge Amounts of Data Present Huge Opportunities
There were 5 exabytes of information created between the dawn of civilization through 2003, but that much information is now created every 2 days.
– Eric Schmidt, Executive Chairman of Google
How is all of this data being generated?

The data wave isn’t limited to large companies, small businesses are managing and utilizing more data than ever.

Critical Need for Managing and Analyzing Data


This is where data analysis and visualization skills come in.

How Data Analysis and Visualization Helps Organizations

Examples of How Data Science has Changed Roles and Industries


Some of Our Favorite Data Visualizations
You likely know that data science is a growing career, and both data science and data visualization skills are in demand. But when considering what to invest in for their own career growth or how to help their organization best, people sometimes have a problem, pardon the pun, visualizing how visualization skills will help them in their career, or even when they’d use the skills. They think, “I’m taking a table with numbers and making it into a chart” Yes, that’s one type of visualization, but when done well, visualizations can be so much more.
Now we’re going to show you some of our favorite visualizations. While we’re at it, we’ll look at how data visualizations are used across a number of roles, talk about the tools used, and show you how acquiring these skills can be a differentiator for your career.
Use Case: Data Exploration
One of the best uses of data visualizations is to enable people to see data in ways they could not before. This is often done by bringing insightful data forward so it is not obscured by other data or displaying it in a way that allows you to see a correlation that wasn’t obvious before.
Interactive Government Budget 2016
The United States federal budget is extremely complex. Most people don’t track it closely. We might know the particulars about programs or projects that are important to us, and we likely often wonder where all our tax dollars go. In 2016, the Obama administration tried to address that issue by creating an interactive budget chart.

This shows how well visualizations can show and explain complex data and how they allow people to explore numbers in ways that they would not normally be able to. By spending only a few minutes with this visualization, you will likely discover things you didn’t know and get insights into how your tax dollars are used.
Source and for more information: Try the real interactive 2016 here to see where your tax dollars went.
Tools: This type of interactive treetop can be created in Tableau or Power BI or through coding.
US 2T Stimulus Bill
Similar to the visualization above, this visualization by user SevenandForty posted in the dataisbeautiful subreddit shows where the money from the 2 Trillion dollars of the 2020 stimulus package went.

This is a Sankey Diagram, which is a unique type of flow diagram for visualizing source-to-destination types of data. Marketers may be familiar with it because Google Analytics offers a Sankey diagram for tracking user flow through websites (this was formerly called the user flow diagram, and Google Analytics 4 is the path exploration). While the above diagram simply shows originating funds to end spending, Sankey diagrams can be very helpful for tracking decisions and can highlight cause and effect. Using Google’s path exploration as an example, that diagram can help you isolate pages that are making visitors leave your website.
This Sankey diagram helps you see exactly where the funds are going and compare which sectors and services got the most funds.
Source and for more information: r/dataisbeautiful
Tools: This type of interactive treetop can be created in Tableau or Power BI, but it is not a default chart type, so custom-calculated fields and bins must be created in order to make a visualization like this. But that only takes about 10 minutes.
Use Case: Information Presentation
Sometimes visualizations are just much better at conveying information in a meaningful way by showing instead of telling.
Every Upcoming Solar Eclipse
What to know when you can see the next eclipse? This simple yet elegant animated visualization shows every upcoming eclipse and where it can be seen from Earth:

Not only is the page a great source of information about eclipses, the visualization the interactive visualization shows you where you can see an eclipse!
Source and for more information: The Washington Post
Tools: This is a custom visualization created with by laying different color lines of a 3D globe. The interactive portion allows users to grab and turn the globe. You can create a similar visualization with something like Tableau or Power BI using a flat map of the earth and plotting geographic coordinates of eclipse paths, javascript, python or some other scripting or programming language is required to cradle the globe and interactivity.
The Increasing Number of Data Breaches
Another great visualization from the subreddit r/dataisbeautiful. When viewing the source and more information for this interactive visualization, be sure to scroll down to look backward in time at previous years. Doing that shows you how the number of breaches is growing.

The visualization has many interactive elements. In addition to scrolling down or up to move backward or forward in time, you can hover over any breach to get a summary of the events and click the text to be taken to a web page about the event.
Source and for more information: r/DataIsBeautiful
Tools: This visualization is essentially a packed bubble plot with the size of the data breach determining the size of the bubble. The information is plotted vertically by year and horizontally by month. A plot like this can be created in Tableau or Power BI and can be made interactive with Actions in both tools, where you can add more data (such as the event summary) on mouse hover and provide a linked URL when clicked.
Use Case: Dashboards - Visualizing Information and Correlating Data
Dashboard visualizations are great for many things, they:
Let you see updates at a glance.
Bring the most important information to the forefront.
Let you filter information so you can focus on what you’re interested in.
They let you see correlations between data.
Visualizing Sales and Sales Pipelines
Sales dashboards are one of the most common types of dashboards as they allow salespeople, managers, and executives to visualize where deals are in the sales process, which customers you’re talking to, and which salespeople are engaging. Tableau has several examples of sales dashboards:

This next dashboard gives sales analysts, managers, and executives insights into what deals are in the pipeline, what opportunity stage they’re in, how big they are, and which sales reps are driving them to show performance and estimate resource needs and inbound revenue.

Source and for more information: Tableau Blog
Tools: This visualization was created in Tableau and could also be created in a tool like Microsoft Power BI.
Visualizing Supply Chain Issues
This dashboard used by a grocery retailer aims to address supply chain issues and help ensure that the correct products are stocked at the correct inventory levels in the correct stories. The dashboard helps logistics analysts and procurement experts analyze product availability by category, supplier, day, and store region, drill into details and find ways to optimize the supply chain.

Source and for more information: Tableau Blog
Tools: This visualization was created in Tableau and could also be created in a tool like Microsoft Power BI.
Visualizing Real Estate Trends
Data visualizations can help realtors and real estate companies know to set the best listing price for sellers and provide the best buying advice to buyers. Reports can show many things, and the report below seeks to answer one of the first questions all sellers and buyers have, “Is this a good time to enter the market?" The dashboard below helps buyers and sellers see trends in the market, the volume of homes on the market, and if prices are rising or falling. This arms buyers and sellers with better information, allowing them to make better decisions.

Source and for more information: Tableau Blog
Tools: This visualization was created in Tableau and could also be created in a tool like Microsoft Power BI.
Use Case: Telling a Story with Visualized Data
Storytelling is an art form that resonates. As people, we pass along and absorb events, perspectives, and lessons learned through stories. So what is a data-visualized story? It’s adding data and information to a story, or, from a different perspective, adding dates, times, outcomes, and results or impact to data to show events progressing over time and their cumulative impact as well as the final outcome.
Napoleon’s Disastrous Russian Campaign of 1812
One of the most famous data-visualized stories is Charles Minard's map of Napoleon's disastrous Russian campaign of 1812. The visualization has two dimensions and shows six types of data:
The number of Napoleon's troops: Perhaps the most compelling part of the graphic is the number of troops is shown by the width of the tan and black lines as they move east into Russia, then retreat back. The width is one millimeter per 10,000 soldiers. Numbers are also written beside the zones.
Distance. In leagues, see the scale on the mid-lower right.
Temperature. The table at the bottom is overlaid with data, and with the temperature scales on the lower right.
Latitude and longitude.
The direction of travel. Represented by the tan (red) and black lines of soldiers moving left (east to Moscow), then right (west) back to France.
Location is relative to specific dates. Overlaid on the graphic table.

Source: Wikipedia article. See also the enlarged map.
Tools: Tableau has a story visualization that allows you to put events together to tell a story with different visualizations in different ways. You could use Tableau to create a story that would showcase the different elements of data shown in the visualization above, though not likely in quite the same way. To recreate this visualization with these dimensions and stats, you would likely have to create it code using something like Python.
Use Case: Research, Investigation, Making your Point
Sometimes telling isn’t enough. You have to show your work to get in order to make your point.
1854 Broad St Cholera Outbreak
In 1854, London had a serve outbreak of cholera in Broad St. in the Soho district of the City of Westminster, London, England. It caused the death of over 600 people and was studied by John Snow (not the Game of Thrones character, but a real Physician in London). He made a great visualization that showed clusters of cases using vertical bars laid over locations on a map of the Soho district, as well as the pumps and water lines feeding the area with (as he determined) contaminated water.

The result changed the scientific understanding of how cholera spreads. Previously thought to be transmitted through the air. After doing the research and focusing on death rates, Snow came to believe contaminated water was the source. In fact, it was, as water companies were delivering untreated and highly contaminated water from the river Thames.
Source and for more information: Wikipedia
Tools: To recreate this today, you might use Tableau or Power BI, but instead of bars, use a bubble chart over a map or a density map to show the clusters of cases.
Florence Nightingale - Causes of Mortality Armies of the East
Florence Nightingale was a nurse and a pioneer in many ways. She authored over 150 books, pamphlets, and reports on health issues and is probably best known for helping improve sanitary conditions. She was also a mathematician who pioneered the use of what we now call the polar area diagram pie chart. In 1859, Nightingale was elected the first female member of the Royal Statistical Society, and in 1874 she became an honorary member of the American Statistical Association.
Perhaps her best know data visualization was created to drive home her point that the mortality rates of British soldiers in the Crimean War were greatly exacerbated by poor sanitary conditions in hospitals.

The Diagram of the Causes of mortality in the army in the East" helped show that bad drainage, contaminated water, overcrowding, and poor ventilation were causing the high death rate among British army casualties in India. “Following the report, The Royal Commission on India (1858–1863) concluded that the health of the army and the people of India had to go hand in hand and so campaigned to improve the sanitary conditions of the country as a whole
Nightingale made a comprehensive statistical study of sanitation in Indian rural life and was the leading figure in the introduction of improved medical care and public health service in India. In 1858 and 1859, she successfully lobbied for the establishment of a Royal Commission into the Indian situation. Two years later, she provided a report to the commission, which completed its own study in 1863. "After ten years of sanitary reform, in 1873, Nightingale reported that mortality among the soldiers in India had declined from 69 to 18 per 1,000".[68]: 107
Source and for more information: Wikipedia and Diagram of Causes of mortality in the army in the East.
Tools: To recreate this today, you might use Tableau or Power BI.
Impact of Fossil Fuels on CO2 Concentration in the Atmosphere
Data visualizations are part science and part art. Depending on the creator’s creativity, the art might functional, compelling, or even beautiful. Some visualizations transcend even that.

This visualization does an excellent job with the scientific part of data visualization. It shows the increasing amount of fossil fuel emissions on the bottom, with marks getting denser as you moved through time from 1850 to 2100, and the corresponding increase in the concentration of CO2 in the atmosphere.
The art portion of this visualization is stunning. It looks like smoke rising into the atmosphere and getting denser with every passing day.
Source and for more information: Behance
Tools: This was created using D3.js, a javascript library for manipulating documents based on data. Recreating would require scripting or coding.
The Danger Posed by Iceberg A68a
Here’s the difference between telling and showing:
Telling: “Hey, there’s a really big iceberg moving into the South Pacific, and the collision could cause an environmental catastrophe.”
Showing: “Hey, there’s a really big iceberg moving into the South Pacific, and the collision could cause an environmental catastrophe. Look how big it is!"

Source and more information: Reuters
Tools: There is more than one visualization in the source article. Some of the maps can be recreated in tools like Tableau or PowerBI by plotting travel paths over maps. Some of the size comparison visualizations can be recreated using a tree diagram. The visualization shown above would be rather simple to recreate by combining images in any tool such as Visme or even Google slides, provided you keep the proportions correct.
Now you’ve seen some of our favorite data visualizations. All of them are compelling and brilliant in their own way, some were pioneers, and others verge on works of art. If you aspire to build visualizations like these, more power to you, we can’t wait to see. But remember, your data visualizations don’t need to be works of art. The true power of data visualizations comes from the simple fact that they make things easier to see and understand. That power can be seen in even the simplest visualizations like this one above.
8 Examples of Actionable Insights from Data Analysis
So far we’ve told you a lot about the power of data analysis and visualization so now we’re going to take our own advice, and instead of telling you, show you. We’ve picked eight examples to show how data analysis generated actionable insights that organizations were able to use to improve processes, reduce costs, and seize opportunities.
Supply Chain: Keeping Shelves Stocked

Problem:
Pepsi Co found some products flying off of shelves at the start of the pandemic and wanted to help clients manage inventory to meet demand.
Solution:
Clients provided warehouse inventory and POS data to Pepsi, and Pepsi used the data to predict out-of-stock, reorder alerts, and shipment communications through a machine learning algorithm.
Benefits:
Stocked Shelves: Pepsi helped its customers have the right products in the right volumes and at the right time.
Cost Savings: Pepsi paused marketing campaigns for products that were in high demand, saving advertising dollars.
Healthcare: Improving Practitioner Soft Skills
Problem:
One health system analyzed data on patient experience with medical practitioners. Data analysis showed that some practitioners prioritized scientific facts over patient experience leaving the patients feeling that the doctors weren't empathetic.
Solution:
Doctors received empathy training to help with patient communication.

Benefits:
Improved Patient Safety: Patients felt heard, and communication in both directions improved resulting in better patient safety.
Fewer Malpractice Issues: Practitioners who took empathy training have fewer malpractice claims.
Healthcare: Detecting Anomalies

Problem:
Evaluating MRI scans and other medical 3D imaging was taking too long, delaying essential treatment.
Solution:
In 2018, researchers at MIT created an algorithm that detects differences in MRI scans and other 3d images 1,000 times faster than humans.
Benefits:
Faster, More Accurate Diagnoses: Patients got an accurate diagnosis and started treatment earlier, in some cases leading to better outcomes.
Healthcare: Outbreak Prediction
Problem:
Predicting outbreaks of viral diseases so that healthcare systems and support services are prepared.
Solution:
The Centers for Disease Control uses outbreak analytics and forecasting to anticipate spikes in cases of COVID-19.

Benefits:
Anticipate Staffing and Supply Needs: Hospitals can anticipate the needs for staff, supplies, PPE, and patient beds and be better prepared to meet needs.
Provide Guidance: Helps prepare and inform decisions made by state, local, and school officials to combat spikes in cases.
Inform Personal Choices: Provides information so individuals can plan travel and interaction according to their needs.
Manufacturing: Product Quality Improvement

Problem:
One plastics manufacturer sought to improve the quality of its production process to reduce malformed parts.
Solution:
It analyzed 612 unique production parameters across 12 machines to identify parameters impacting product quality and made improvements.
Benefits:
Less scrap: Modifications resulted in a 22% reduction in scrapped parts.
Better throughput: The reduction in scrapped parts resulted in a 15% increase in throughput.
Manufacturing: Predictive Maintenance
Problem:
A semiconductor wanted to reduce the cost of replacement parts for machines used for manufacturing and reduce unplanned maintenance.
Solution:
They monitored machine, operational, and system data for the equipment and compared it to known normal baseline operational data to determine when machines and components needed maintenance.

Benefits:
Reduced Maintenance Costs: Machine data goes beyond predicted mean-time-to-failure and periodic maintenance schedules allowing maintenance to be performed only when needed for components required.
Reduced Unplanned Downtime: Costly downtime is minimized and unplanned downtime due to unexpected failures is reduced due to timely maintenance based on the machine's component health.
Extended Useful Life of Components: Machine parts, which previously might have been replaced before the mean-time-to-failure period, can continue to be used while they are operating within acceptable parameters. Saving costs and increasing ROI of equipment
Process Optimization: Cost Reduction

Problem:
Vodafone wanted to know why they had a low number of cost-saving automated transactions.
Solution:
They used data analysis to implement new robotic process automation (RPA) with improvements to its process.
Benefits:
Reduced Costs: Implemented robotic process automation (RPA) to improve its order process resulting in an 11.5% reduction in processing costs.
Process Optimization: Identify and Eliminate Bottlenecks
Problem:
BridgeLoan was concerned that their loan application process was too slow, reducing the capacity for loan approvals.
Solution:
They integrated a process mining tool into their ERP system to identify the bottlenecks in their loan application processes, analyzed the data, and used the insights to reimagine and recreate their application process.

Benefits:
Increased Speed and Capacity: Improved loan processing time by 40% and increased the capacity of loans processed per month.
Which Tool is Right for Your Data Science Task?
We’ve discussed the benefits of data analysis and shown you the power of data visualization. At this point, if you’re considering adding data analysis or data visualization skills to your portfolio, you’re probably wondering which tools you should focus on. This is a common question. There are a lot of data analysis and data visualization tools out there, all of them with different features and capabilities, and people often wonder which tool is best for their task. In other words, when should I stop using a spreadsheet like Excel and start using a data visualization tool like Tableau, and when should I start creating custom solutions using something like Python? That's a difficult question to answer, but we will try.
To answer the question, we're going to focus on some of the most popular tools that we use the most: Excel, Tableau, and Python. We're also going to keep to generalities, so what we say about Excel also applies to Google Sheets, and a lot of what we say about Tableau also applies to Power BI (we much prefer Tableau to Power BI, but that's a different article for a different time). You likely also know that those apps have some similar capabilities; you can create bar charts with Excel and Tableau. You're right, so we're going to take an opinionated approach and tell you what we prefer to use for different types of data analysis and data visualization tasks and why.
This is Not a Feature Comparison
Let me emphasize that we are not comparing products, we’re stating our preferences. There are lots of good articles comparing and contrasting Excel and Tableau, some of which are listed below:
From Tableau
From Simplilearn
From 365 DatasSience
Task Data Entry, Data Collection, Data Storage: Excel
We use spreadsheets, and we use them a lot. There's a big difference between spreadsheets and an app like Tableau:
Spreadsheets like Excel support data entry and data storage, but data visualization software like Tableau does not. You can't type data in Tableau or use it to create a budget.
We use spreadsheets to:
Make estimates and set budgets for every project.
Track bugs in our QA test projects (yes, we have full bug tracking solutions, but not all of our clients do, and spreadsheets are the universal solution.
Provide project reports to clients.
Provide bonus reports to employees.
Document our training class schedule, then publish it via a plug-in.
Track anything and everything that is tracked by line item individually or shared amongst a few people.
Creating Visualizations
We create zero visualizations in Excel for ourselves, although we will do it for clients if that’s how they want them delivered. We don't use Excel to create visualizations because Tableau is so much better. Yes, Excel has the tools to create basic charts in a few clicks, but they are not intuitive or flexible, and the first step in creating a chart is often reorganizing, sorting, and filtering data and, in some cases applying aggregations. Beyond that, customizing visuals to make them perfect for a presentation or visualizing different levels of detail gets complicated and difficult very quickly. All of that is super easy in Tableau.
In Tableau, once the data is connected, you drag and drop the fields you want to, then choose the type of visual you want with a single click. It's super fast and easy. Then you can start playing with visualizations and adding data, sorting and filtering the visualization, and customizing the level of detail to see exactly what you want.

The line chart above shows company sales across three separate segments, with aggregated data and a forecast, and an interactive filter to allow users to select the segment they want to focus on. All of it was done by drag and drop and clicks (no coding) in less than three minutes.
In short, Excel can create basic charts, but if you want more advanced or complex charts and want to use them as part of a presentation or share them with a team or your clients, Tableau will let you create much better visualizations, faster. Tableau also has more robust filtering options, including global filters that apply to all visualizations and worksheet-specific filters, which give you more ways to showcase your data.
Building Dashboards
Dashboards are the natural evolution of visualizations. Dashboards have multiple visualizations, different types of charts, and graphs that show different insights about a common topic, such as a project, sales data, production information, or whatever you need. Again, you can build dashboards in Excel, but it's not designed to do that. Tableau lets you create insightful and elegant dashboards quickly and easily. Furthermore, Tableau's interactive filtering makes it easy to isolate data you're interested in and analyze it. You can even link tooltips to other visualizations to provide deep and rich visual insights.

Tableau visualizations support tooltips and drill-in.

Data Analysis
Speaking of analysis, what do we use to analyze data? Before we answer that question, you need to understand that Excel and Tableau provide fundamentally different types of analysis. Excel is a spreadsheet. Everything is in rows and columns, and that’s how analysis is performed in Excel, by aggregating and comparing data in rows and columns. In Tableau, everything is a visualization, and you analyze data visually.

Another illuminating thing about the difference between how Excel and Tableau are used is that, in Excel, visualizations are created after analysis to showcase findings, whereas, in Tableau, visualizations are used in the analysis process to find those insights and to showcase them.
Both Excel and Tableau let you create calculated fields and data; we feel that Tableau makes it faster and easier to do that at scale. Another key difference is that Tableau supports drill-in automatically, letting you change the level of detail to match what's required for the analysis you're performing. That can get tricky in Excel.
So the question remains; what do we use to analyze data? The answer is both, depending on the amount of data and depth of analysis we're performing. If we're building an estimate for a client and trying to meet their budgetary requirements, we'll put different options in multiple columns in a spreadsheet, add them up, compare them, and tweak numbers to find the best options for the client. If we have multiple spreadsheets tracking software bugs and want to perform deep analysis to discover what the most common bugs are, which bugs take the longest and shortest time to fix, and which type of bugs generate more cascading issues, then that's a job for Tableau.
Generally speaking, if the data to be analyzed is on a single viewable page on a spreadsheet and involves fewer than five columns of data, and we're performing a simple analysis, such as comparisons, then we'll do that in a spreadsheet. If it goes beyond, if it involves data from multiple sources, or even multiple worksheets, or involves deeper analysis, we'll do that in Tableau.
We always do Exploratory data analysis in Tableau. What is exploratory data analysis? That's when you know your data has information, but you're not entirely sure what you're looking for. Exploratory data analysis is what you do when you don't understand everything about the data you have. Developing that understanding usually generates insights along the way. Take the Excel example about creating an estimate, in that case; we know what we're looking for; costs per line item, the totals based on different options, and a comparison of different packages of options. The bug report analysis is exploratory data analysis. Yes, we have a general idea of things we want to understand more clearly, but don't know for sure what other insights we'll find along the way. For example, we may find that some people on the developer team aren't performing unit tests which is leading to more bugs.
Working with Data Sources
Another big difference between Excel and Tableau is that Excel is designed to read and store data in a single file, which, inside of Excel, can contain multiple worksheets, but Tableau is designed to work with multiple data sources, including very large databases. While you can get external data for Excel, that’s not typically how we use it. Other people do, but many simply export the data to a .CSV file and open it in Excel.
If you start working with data from multiple data sources and want to maintain a live connection to those data sources for data refresh and scheduled reporting, the challenges get bigger. You have to do a lot of data cleaning, preparation, and transformation to get the data ready for analysis. Excel's Power Query is a nice tool with a smart and easy-to-use interface that is very nice for connecting to data sources and even raw data from the web if you're working with a single table of data. When you go beyond that, Tableau's Prep and Flow tools are better.

Tableau's Prep Builder provides better flexibility in how data is joined and merged and is better at visualizing the cleaning, preparation, and transformation processes through flow diagrams. These make it much easier to maintain and troubleshoot data issues, make changes to data preparation steps, or merge new data sources. The image above shows four data sources being joined, cleaned, and transformed.
Tableau lets you fully automate data preparation steps without using macros and create schedules to refresh data automatically.
Sharing and Collaboration
Some of the comparison articles listed above make the case that "Excel is not a good fit for agile business practices," where data analysis and visualization are concerned, meaning it's not easy to share data easily and securely while maintaining data connections and integrity.
Excel is file-based, and it's designed to share by sharing the file. While Excel does support coauthoring, the default method of sharing is saving a file to a file share where others can access it, and the online sharing tool of choice would be Sharepoint. Herein lies the problem, the only built-in access control to Excel files is password protection, and if you don't use that, you have to rely on file share permissions, or Sharepoint permissions, two different sets of permissions set in different places, often by different admins. This, coupled with the fact that people tend to lean into what they know when trying to get things done, means that Excel files often get shared. This can lead to people using files with data that is out of date or having different files updated and used by different teams and people. . This can lead to what they used to call the problem of ‘different versions of the truth’ because people are working off of different files. That was a polite way of saying no one has good data.
Tableau, on the other hand, has a built-in sharing and collaboration platform that is either cloud-based, Tableau Online, or on-premises Tableau Server. You create separate workspaces and assign fine-grain permissions to data sources and workbooks to control who can view and edit workbooks and data sources. You can even control if raw data sources can be viewed and if workbooks and data can be downloaded.

Tableau lets users subscribe to worksheets to see changes delivered to their inbox on a schedule they set, @mention other users in comments, and create alerts based on the data in visualizations so that they are notified when data-based thresholds are crossed. For example, the VP of Sales can set an alert in a report to be notified when total sales for the year exceed the previous year. Tableau is designed for this and designed to do it with good data governance practices.

Reporting
For reporting, we use both Excel and Tableau, and our preference depends on what's being reported and what the reports are supposed to show. We deliver lots of reports in Excel where the data is best represented in a spreadsheet and is contained in a single worksheet, such as a bug list or test results. Individually, these make data and results easy to see and compare. Again, for doing a quarterly rollup, we'd likely bring the data into Tableau to build a series of visualizations.
If the data is large and complex, if it's best presented visually, or if it's going to be shared with executives or clients, we lean toward Tableau. All the reasons listed above make Tableau the better choice for creating and sharing visuals with people inside your organization, and Tableau dashboards are very good presentation tools. Tableau also has richer export options, letting you export to both PDF and PowerPoint directly, and letting you control which visualizations you export. You can also embed Tableau visualizations in web pages.

Python
Where does Python come in? Python is a programming language that is easy to learn and great for working with data. We turn to python when it's better at performing a specific data science task or when we need to do something that other tools can't do and when custom automation is called for.
What Python Does Better
Perform complex or highly customized data cleaning, transformation, and preprocessing where multiple custom or logic-driven steps must be taken, or exterior lookups to other data sources are required to properly prepare or engineer the data.
Cleaning and transforming large amounts of data from previously unknown or unused data sources. Tableau is great at working with data sources when you know their features. When we don't know anything about the data, we prefer python because it allows us to more quickly analyze data for features, perform imputation to add values to datasets and perform deduplication across multiple data sets.
Examining frequency distribution to determine the best way to statically analyze a data set, taking standard deviation, variance, skewness, kurtosis, etc., into account. Python's ability to output simple visualizations from libraries, such as Matplotlib and Seaborn, allows you to visualize distribution.
What Python Does that Excel and Tableau Can't
Perform automated data mining by scraping data from websites with libraries like Scrapy and BeautifulSoup and creating structured data from it.
Image processing for data analysis, such as classification or identification.
Natural language processing for data analysis for classification or identification.
Building machine learning apps to create estimations, including creating data models, training data models, testing hypotheses, and building data pipelines to replenish models with new data. Python is also an excellent tool for tuning and optimizing models to reduce variance and bias while not making the model too complex or introducing too many errors.
Which Tool is Best for What You Need?
We've discussed how we use Excel, Tableau, and Python for different data analysis and visualization tasks. As stated earlier, these are preferences, and we have the advantage of knowing how to use all three tools very well. There are also many other tools for data analysis and data visualization that we didn’t examine. Ultimately, you’re going to have to try some tools and figure out what works best for you. We hope the information presented here helps you make your choices. If you use Excel but have never used Tableau or Python, maybe it's time to give them a test drive. For Tableau, a great place to start is our one-day, Tableau for Data-driven Decision Maker's course. For Python, see our list of Python courses, or contact us for the best place to start your Python journey.
How to Start Your Data Science Journey
If you’re interested in data science, the natural follow on question is should you become a data scientist? Data science is a large and expanding career field, and there are different data science jobs out there and a lot of ways to obtain the skills. You must decide if you want to become a data scientist or if you’d rather add data analysis and visualization skills to your current job role. Either way, we’re now going to look at what it takes to get started on your data science journey. From the skills you need to what you must have on your resume and the different training and education options you can choose, and the benefits of each.
Education
Traditionally, entry-level data scientist positions start with masters or Ph.D. requirements. A master's degree typically requires 30-36 credits, and while it can be completed in a single year, two years is more common, especially for people who are working and going to school part-time. The cost of a masters is around $30,000. A Ph.D. requires 90-120 credits and must be completed within seven years, and can be completed in two years (if you don’t like the company of humans or seeing the sun), and is often completed in four and a half to five years. Ph.D. programs typically cost $30,000 a year, so the total cost can run upwards of $150,000.
Those types of programs are certainly valuable, and most postgraduate programs facilitate connections to local employers as part of the coursework and offer job placement assistance after graduation. These choices often come down to your current life stage, commitments, and drive. While financial assistance is relatively easy to get, you will have to pay it back, and it doesn’t help pay for a mortgage or children if you have either of those. Like an MBA, a master's degree in data science is often a better choice for people working a full-time job and is still a very large time and monetary commitment. Beyond those types of programs, you have options like massive online open courses (MOOCs) covered by Udacity, Courser, or others, which can give you a nano degree. Those programs offer a lot of different courses and allow you to go fairly deep into many areas of data science, but the learning is self-paced. That is to say, it's up to you. Many programs do offer mentors that are available to give advice, support, and review projects.
Outside of that, you have the option of teaching yourself data science with online self-paced learning. That approach will be entirely dependent on your ability to stay motivated and put in the time, the same as with a nano degree program, but you won’t likely have access to a mentor unless you know a data scientist personally who’s willing to take on that role. You might also struggle to find good sample data science projects or data to play and learn with. Then there’s instructor-led training like we offer, which puts you in daily contact with your instructor, who is with you every step of the way. While you leave those courses with a very defined set of skills that directly translate to job tasks, these courses require your focused attention for a few days or a few weeks, depending on what you’re trying to learn.
With the options laid out, let’s look at what employers look for when they hire for data science positions.
What Employers are Looking For
Employers generally list a masters degree as a requirement for entry-level positions, but many also will accept candidates with equivalent experience. What is equivalent experience? That’s up to the employer. Organizations use data science in many different ways. Manufacturers may use it to optimize processes, retailers may use it to anticipate inventory levels, logistical companies to determine population movement, and healthcare companies to identify deformed human cells. The possibilities are endless, and an article from KDNuggets that examined data science position hiring practices stated:
Every company looks for something different. What gets you hired at Google may or may not work at other companies (and may even be meaningless). So building the “perfect” all-purpose data science resume is all-but-impossible.
Tip: If you’re applying for a data science job, ask as many questions are possible of the recruiter prior to the interview to determine how data science skills are used, what business or organizations goals data science is helping achieve, what type of data you’re working with, how AI and machine learning are used, what data pipelines are in place, and what estimations need to be made.
In that same article, they did list some issues that will get your resume discarded by recruiters. Those include:
Focusing on experience with projects from known “training-wheels” data sets from nano-degree programs, including the survival classification on the Titanic data set, the hand-written digit classification on the MNIST data set, and the flower species classification using the iris data set. Recruiters are familiar with these datasets and might not take you seriously if that’s all they see on your resume.
Having only MOOCs projects in your portfolio.
Focusing on areas of data science that are already heavily explored rather than having new work.
In short, if all you’ve done is classroom work with well-known training data sets, you’re not going to stand out from the pack to recruiters or prospective employers. That said, if you’ve done something special, such as a deep dive or performed sophisticated analysis with a training data set, that may be worthy of space on your resume if it’s relevant to the work being done by the organization you’re applying to. Remember, employers want the best people, and recruiters are frequently charged with finding the top 1% or 2% of candidates. You have to show that you’re special in your field to stand out.
Experience is Key
You have to show experience, and you have to show experience beyond coursework and training data sets. So how do you get that? You make data science your hobby and build up a portfolio of projects that increase your knowledge, showcase your skill, and help you stand apart to recruiters reviewing your resume and in interviews. Here are a few tips:
Analyze publicly available data sets to find interesting information.
Compete in Kaggle competitions.
Read everything you can about data science trends and findings, and replicate analysis.
Tip: Make sure you acquire other must-have skills used in almost all data science projects, including the use of version control systems like GitHub and DevOps for developing and deploying data science solutions and experience with DevOps platforms and tools like GitLab, Python, and Flask, etc., and experience in working with databases such as SQL, MySQL, MongoDB and others.
The Value of Data Science Training
So if you need experience beyond what’s delivered in training, you’re likely asking what’s the value of training? The value of training is the same as it has always been to acquire skills. From a degree program to MOOC, to self-paced, to instructor-led professional training, the true value you get is the skills you walk away with. You can’t analyze any public data sets or compete in Kaggle competitions if you don’t know how to perform data analysis, to begin with. So training provides the fundamental stills, the foundational structure on which to build your data science career. Given that, you have more information to consider your training options.
The price of training and the time it takes to complete it are huge factors in choosing how to acquire your data science skills. One reason we have chosen to deliver immersive instructor lead training is that it takes a relatively small amount of time, a few days to a week per course, but during the course, you’re focused on the training, and you have an instructor that is there to provide guidance, insights, and real-world examples every minute of the course and we also offer office hours and email support for a period following the course. We feel deep immersion, focused attention, and lots of practice is the best way for adults to acquire new skills.
The type of training you take can also provide additional value. For example, our courses not only teach skills, but also tools and languages that are in demand, such as Tableau, Power BI, and Python. You can apply those skills in a work environment the day after class or add them as separate skills on your resume. That can help you get a job and get paid, or get paid more in your current job, as you’re progressing on your data science career path.
Choosing the Best Path
We’ve covered what it takes to start a data science career path. The first step is acquiring fundamental data analysis skills. How you do that depends on the time you have, the cost you’re willing to pay, and how you learn best. You should also factor in additional benefits training can provide, such as job placement from college degree programs or in-demand software skills from immersive instructor-led training courses. In the end, the decision is yours, and you should accept the fact that your journey to becoming a data scientist is likely to be a long one. You should select the training that helps you advance on your career path, works with everything else in your life, and, hopefully, provides additional benefits in the process.
Data Analysis and Visualization Classes and Learning Paths
If your focus is data visualization, then you need to learn how to use the tools that can help you analyze data and showcase insights in compelling ways. There are lots of tools out there. In our consultancy and in our training, we focus on three: Microsoft Excel, Microsoft Power BI, and Tableau.
Why these products? Excel is everywhere, and it's often the first tool people use for data analysis and visualization, and it's powerful but not the best for data visualization. Microsoft Power BI is a good data visualization that organizations with Office 365 have easy access to for creating better data visualizations. Tableau is, in our opinion, the best and most powerful data visualization tool available and offers both wide and deep analysis capabilities, as well as rich data visualization and data storytelling capabilities. Some have the option to choose the tool they work with, while others must use the tool their organization has available, which is why we focus on these three tools.
The graphic below shows you the classes we offer, the learning progression, and corresponding certification exams. Click the links in the graphic to go to the course page for more detail.
Python Classes and Learning Paths
Python is an easy-to-learn, human-readable programming language that is extremely versatile with a rich, robust, and active supporting community. For many data scientists, Python is the programming language of choice. Its fast learning curve, ease of use, and support for full object-oriented programming make it a great first programming language. Python has hundreds of libraries and frameworks to make coding easier, and many are specific to data science needs.
Python is a great choice for complex data cleaning, data preparation, and data collection tasks, as well as performing actual data analysis, programmatically creating compelling visualizations, and performing machine learning tasks. In fact, some estimates say nearly 70% of data scientists and machine learning developers use python to capture, clean, and prepare data models, perform complex data analysis tasks, build powerful AI and machine learning implementations, and easily deploy them as apps, to the web, or as web services. If you’re looking to extend your analytical skills, need to work with more diverse and complex datasets, or are building rich only data-driven applications, Python is a great choice.
The graphic below shows you the classes we offer, the learning progression, and corresponding certification exams. Click the links in the graphic to go to the course page for more detail.

AI and ML Classes and Learning Paths
Artificial Intelligence (AI) allows computers to analyze vast amounts of data, something humans can’t easily do. Machine learning (ML) is a subset of AI technologies focused on training machines how to learn how to analyze data using data already collected. AI and ML help organizations obtain actionable insights, make critical decisions, and take advantage of opportunities.
With more data being collected than ever before, machine learning is crucial to organizational success because it can automate data analysis and the generation of estimations allowing those processes to take place in real time without human intervention. Businesses and organizations put ML systems into place to help with everything from loan approvals to diagnosing cancer, automating checkout at retail outlets, to identifying promising sales prospects.
Data science and machine learning go hand in hand. A data scientist tasked with building a system to produce estimates in real time will have to leverage machine learning. In fact, machine learning is becoming one of the most in-demand data science skills. As more organizations seek to gain useful insights from their data, data scientists will have to create systems that can analyze big data and produce accurate estimations using fast algorithms and data models trained for machine learning. ML fundamentals are quickly becoming a standard requirement for data scientists. We offer the following AI and ML classes.
The graphic below shows you the classes we offer, the learning progression, and corresponding certification exams. Click the links in the graphic to go to the course page for more detail.
Conclusion
If you work with data as part of your job, analyzing it, receiving visualizations created from it, making decisions using it, or presenting it, you can improve your career options by improving your data analysis and data visualization skills. If you’re just starting your career or are looking to change careers, data science is a growing field, and people with the skills we’ve discussed on this page are in high demand. Either way, Fulcrum Forge can help you get the skills you need to help your career ambitions in Excel, Tableau, Power BI, and Python. Book your class today, or reach out to talk about your options or inquire about a custom class.
Download this content to share with your team.

